JForecast Making Forecasting Simpler & Better.
JForecast is a Java-based forecasting SDK built on Weka, designed to simplify both time series and correlation forecasting, offering the kind of correlational forecasting support rarely found outside Python.
- Java
- JavaFX
 Weka
Weka
Overview
JForecast is a Java SDK and desktop application built on the power of Weka, providing a robust set of forecasting capabilities for both time series and correlational forecasting, without wrestling with complex pipelines.
What sets JForecast apart is its position as the exclusive Java SDK with state-of-the-art support for correlational forecasting. This capability significantly extends beyond what traditional time series tools offer. It handles predictor-target relationships, missing value imputation, data transformation, and feature engineering in a single, cohesive pipeline.
Unlike traditional forecasting libraries that model each variable independently, JForecast comprehends the relationships between variables. This enables more realistic predictions for problems where one variable is influenced by others, such as commodity prices, demand forecasting, sales, or financial indicators.
Features
JForecast is designed around a small set of well-considered capabilities, each one designed to remove friction at a specific point in the forecasting workflow.
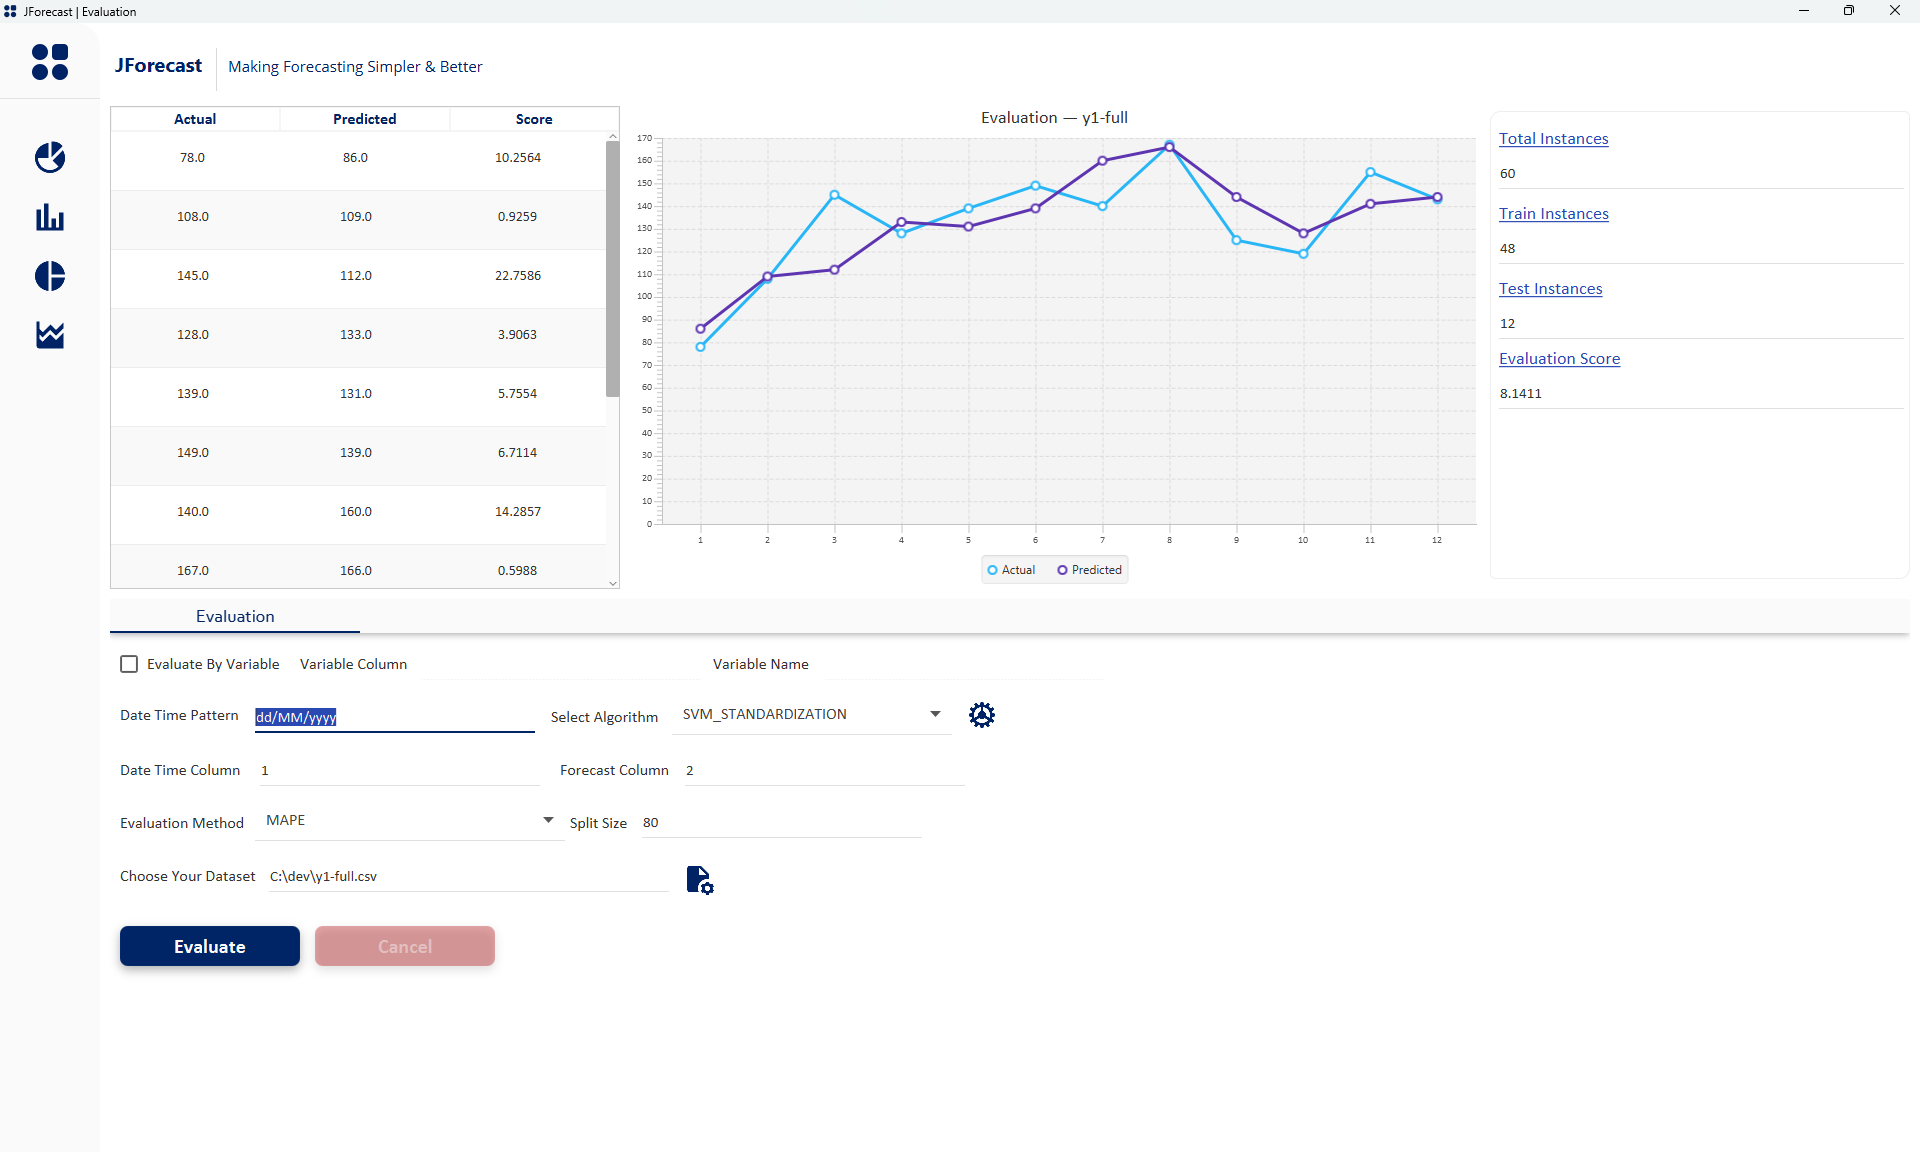
Automatic dataset splitting based on a specified percentage, with built-in support for MAPE and RMSE evaluation metrics. No separate evaluation step is needed.
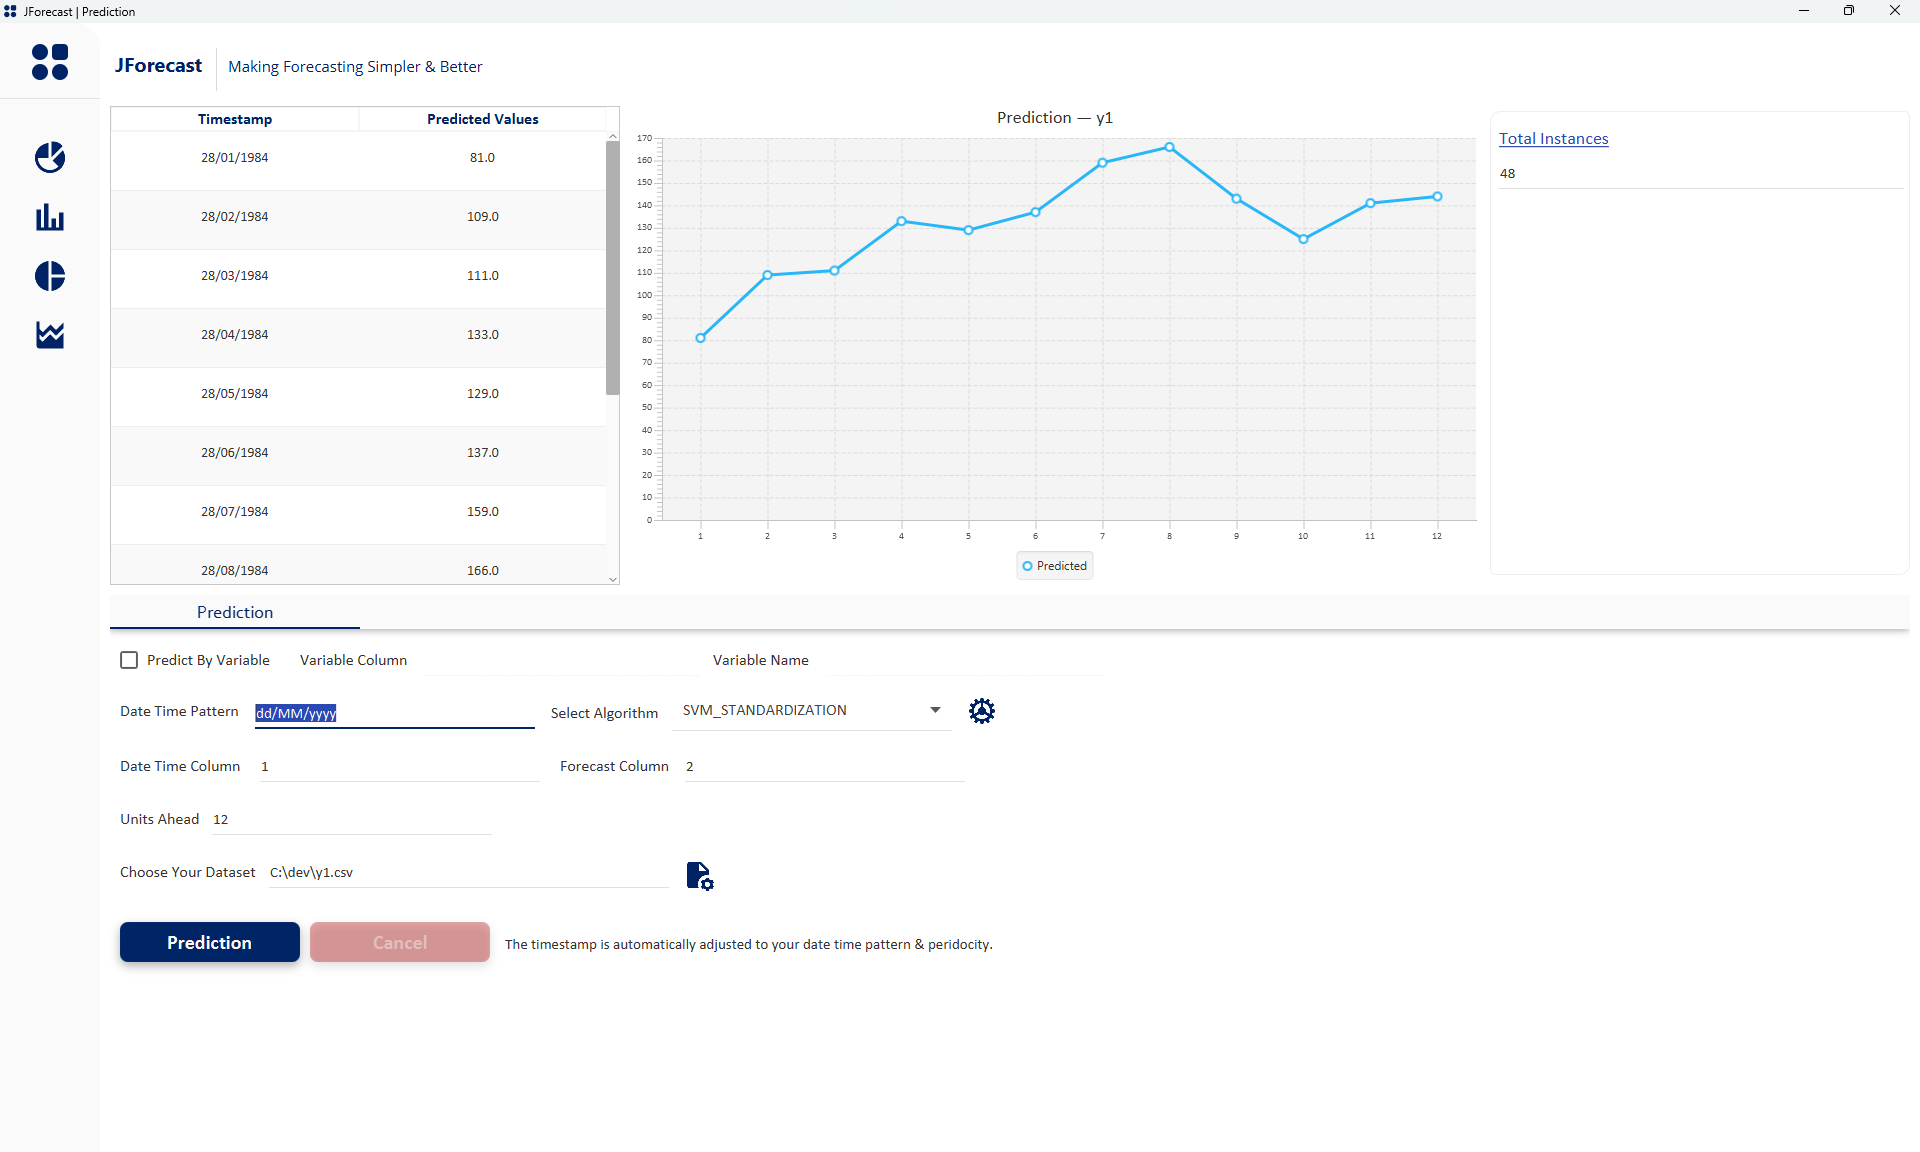
Define what and how to predict in two steps:
- By variable name.
- By units ahead or end date (based on the defined periodicity).
An intuitive, concise API where the forecasting intent is clear from the code itself, with no boilerplate configuration.
Accepts both ARFF and CSV formats, with automatic ascending sort based on the defined dateTime column. No preprocessing is required before loading.
Correlational Forecasting
This is JForecast’s most sophisticated capability, distinguishing it from other tools. Forecasting things like commodity prices or demand rarely deals with one clean, isolated series. For example, corn prices move with wheat and rice. Demand for one product can shift based on the supply of another.
Correlational forecasting operates on the assumption that a target variable is influenced by one or more predictor variables. Consider a simple example: three variables i.e., chicken, fish and beef. The objective is to forecast the price of chicken, assuming it is influenced by the prices of fish and beef.
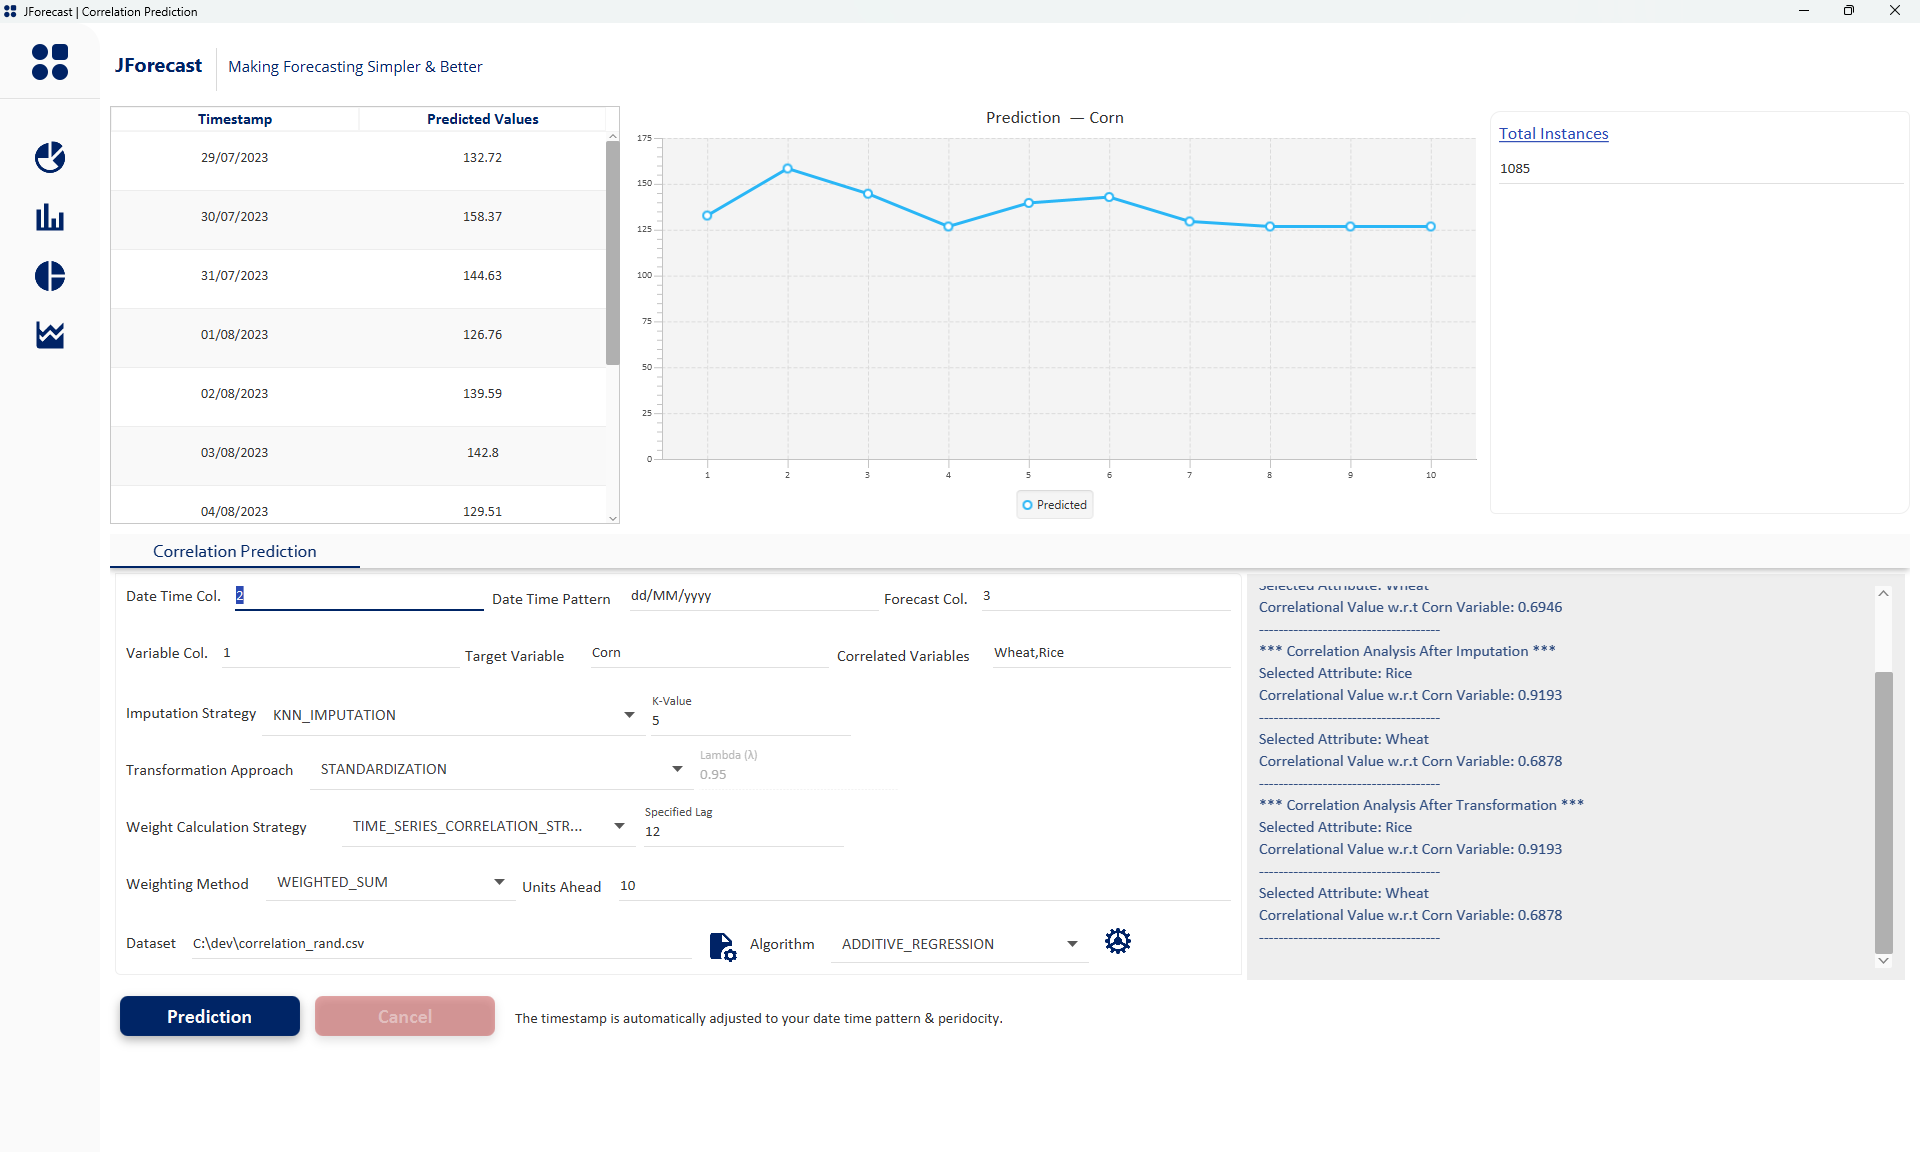
The pipeline is a four-stage process that prepares data, handles inconsistencies, transforms distributions, and then performs prediction using the relationships between variables, not just within a single time series.
Prepares the dataset based on specified predictor and target variables. Sorts by date, aligns predictor and target columns, and structures the instances for the stages ahead.
Handles missing values with a robust approach; addressing the inconsistency challenge where one predictor has a full dataset but others do not cover the same period.
Offers four approaches: Yeo-Johnson, Box-Cox, Log Transformation, and Standardization, to reduce skewed distributions and improve model accuracy.
Captures complex relationships between variables, condenses information and performs correlated predictions with the specified algorithms.
The four transformation approaches are not interchangeable, each targets a different distributional problem. If your data is additive in nature (which forecasting data generally is), start with Box-Cox or Yeo-Johnson: both handle linear and non-linear data well, and if one works on the original dataset, test the other as well.
Log Transformation is suited for exponential growth patterns. Standardization is best when your data has different scales that need to be comparable, or when the specified algorithm is sensitive to feature scale. Choosing correctly is crucial for improving data normality and model accuracy.
Sample Evaluation
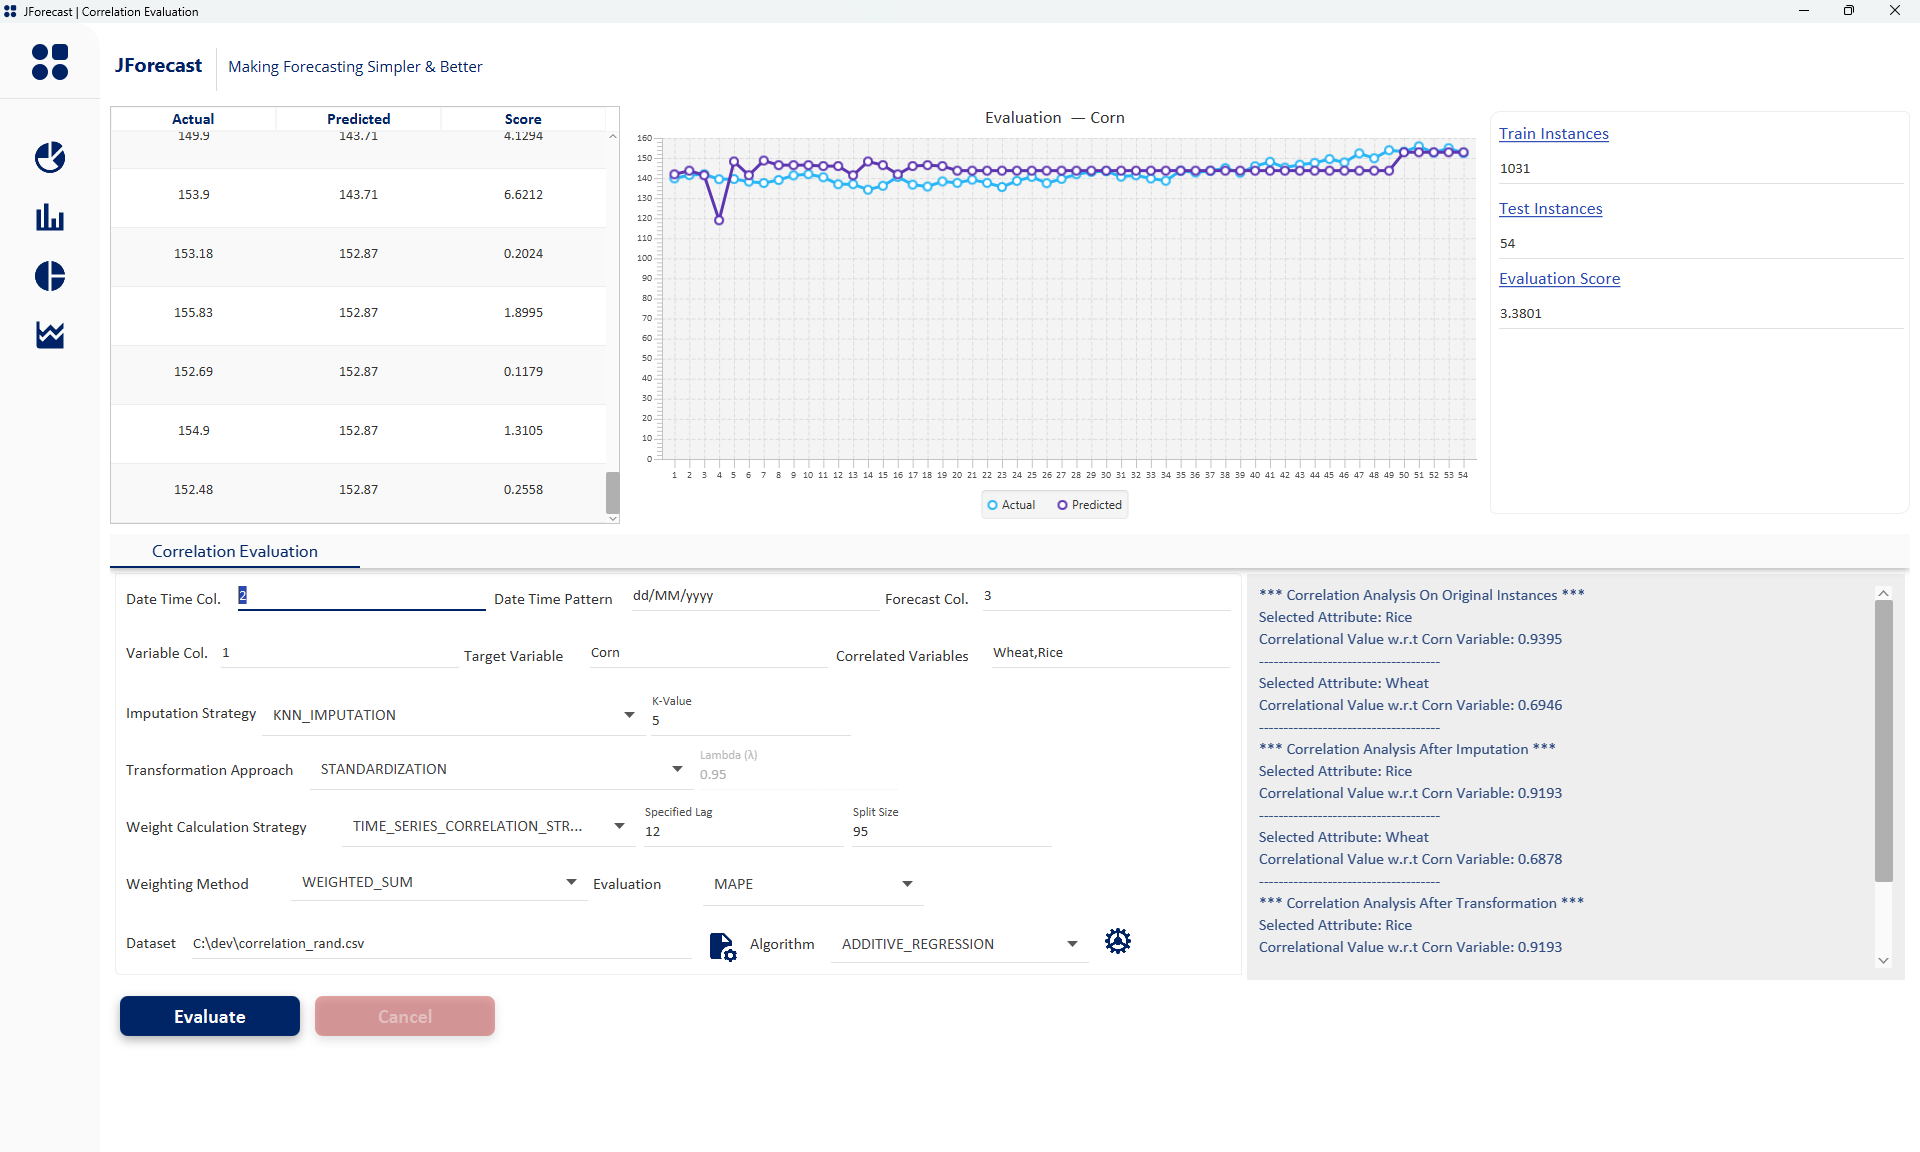
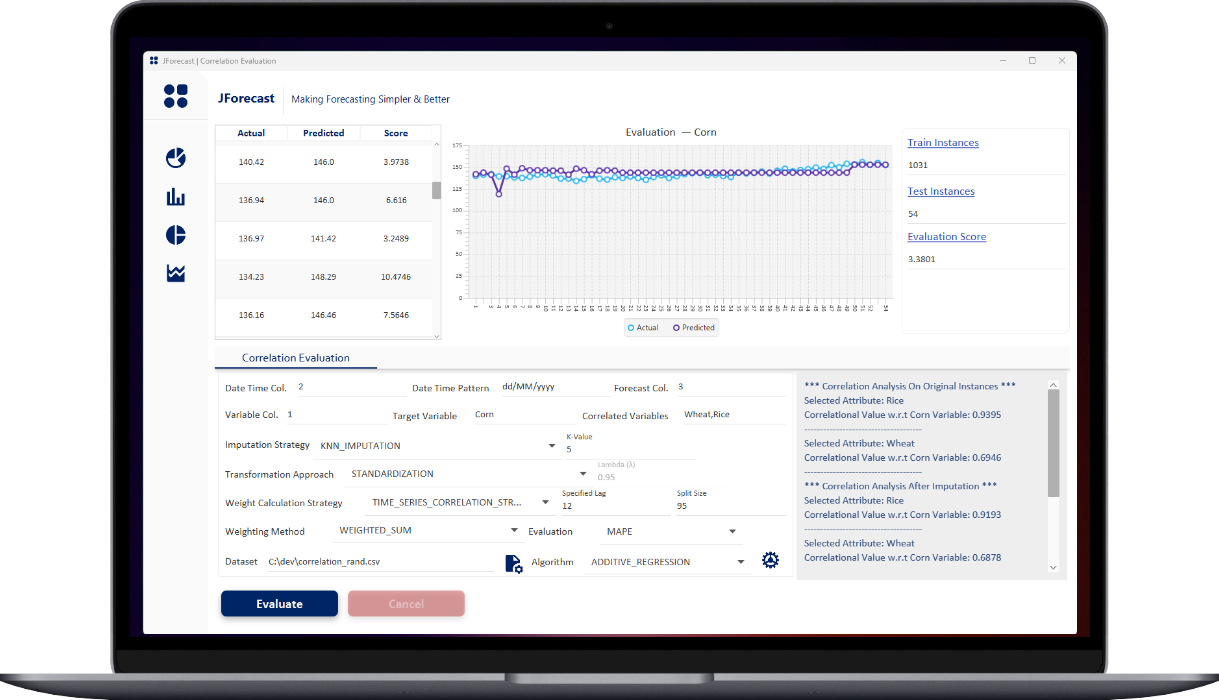
A run against a 1085-instance randomized dataset simulating corn, wheat, and rice price relationships; split ratio 95:5 train-to-test.
Actual vs Predicted – Corn
Forecasting model performance over 54 time periods.
Bottom Line
The only Java SDK with SOTA support for correlation forecasting, filling a genuine gap in the Java ML ecosystem.
A four-stage correlational pipeline (preprocessing, imputation, transformation, and feature engineering) in a single coherent tool, not four separate libraries.
Built-in evaluators with MAPE and RMSE, means the feedback loop is immediate: train, evaluate, and iterate.
A look at the interface